AMD’s Radeon RX 7800 XT is its most popular RDNA 3 graphics card. Powered by the Navi 32 core, it delivers performance comparable to the GeForce RTX 4070. Following the latest price revision, it retails at $489, while the 4070 starts at $519. We’ll test these graphics cards across 33 gaming benchmarks, including 1080p, 1440p, and ray-tracing to decide the winner.
NVIDIA GeForce RTX 4070 vs RTX 4070 Super: Specs Comparison
NVIDIA RTX 4070
AMD RX 7800 XT
GPU
AD104
Navi 32
SMs
46
60
Shaders
5,888
3,840
VRAM
12GB
16GB
L2 Cache
36MB
64MB
Memory bus
192-bit
256-bit
Memory Clock
21Gbps
19.5Gbps
GPU Boost Clock
2,475MHz
2,435MHz
TBP
200W
263W
Price
$519
$489
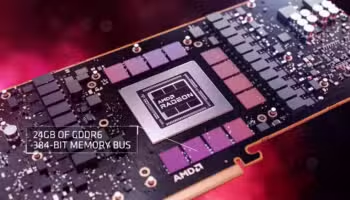
The Radeon RX 7800 XT is the better GPU on paper. It features a 16GB (+50%) memory buffer, a 256-bit bus, and a 64MB LLC (Last Level Cache). Meanwhile, the RTX 4070 offers 12GB of graphics memory, a 192-bit bus, and just 36MB of L2 cache. NVIDIA and AMD use different ALU (core) architectures so comparing those isn’t feasible.
NVIDIA RTX 4070 vs AMD RX 7800 XT: 1080p Performance
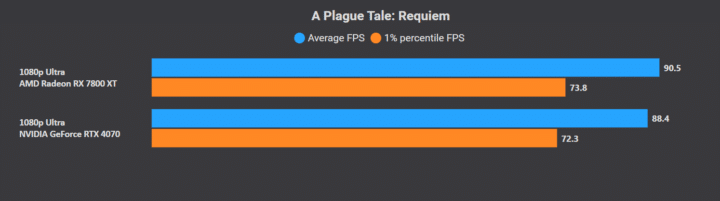
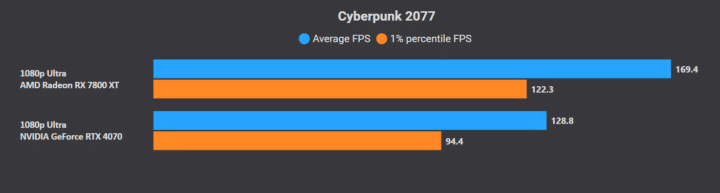
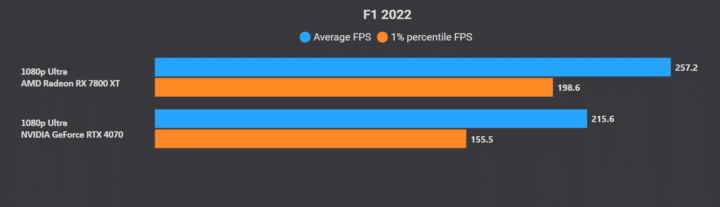
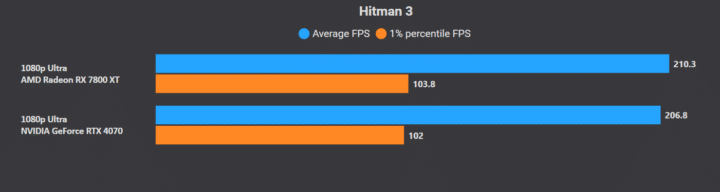
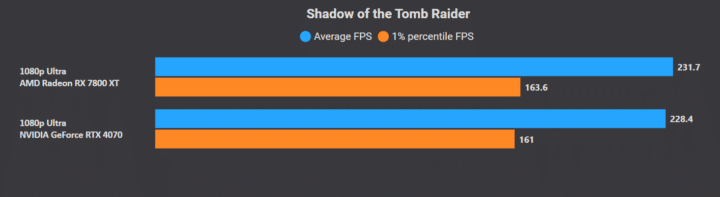
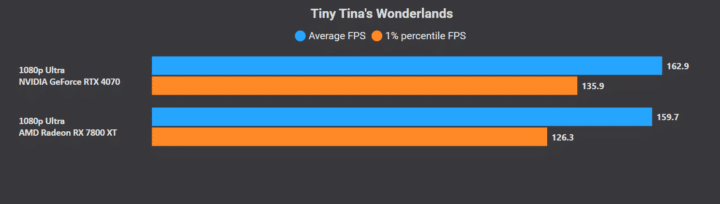
At 1080p, the AMD Radeon RX 7800 XT is +7.4% faster than the RTX 4070 on average. Most titles perform within the margin of error on the two GPUs, but a few (Cyberpunk 2077, F1 2022, and Hogwarts Legacy) favor the 7800 XT, tipping the scales in favor of Team Red.
1080p Performance
RTX 4070
RX 7800 XT
Average Framerate
161.5 FPS
173.4 FPS (+7.4%)
Max Average Power
195W
252W
FPS/W
0.82 FPS/W
0.69 FPS/W
FPS/$
0.31 FPS/$
0.35 FPS/$
The GeForce RTX 4070 has an average power consumption of 195W. The Radeon RX 7800 XT has a much higher power draw of 252W, leading to lower performance-per-watt. The value-for-money aspect is slightly better on the 7800 XT, averaging 0.35 FPS/$ (versus 0.31 FPS/$ on the 4070). Below, you’ll find the performance figures for individual games, including the average and 1% lows.
Processors, PC gaming, and the past. I have written about computer hardware for over seven years with over 5000 published articles. I started during engineering college and haven't stopped since. On the side, I play RPGs like Baldur's Gate, Dragon Age, Mass Effect, Divinity, and Fallout. Contact: areejs12@hardwaretimes.com.