AMD’s Ryzen 6000 “Rembrandt” processors are often praised for their performance and efficiency, doubly more so at or under 45W. Leveraging the Zen 3 core and RDNA 2 graphics on TSMC’s 6nm process, these chips are tailored for high boost clocks and low power consumption. In addition, they’re the first AMD CPUs to feature DDR5/LPDDR5 memory which helps feed the 12 RDNA 2 Compute Units. In this post, we have a look at the ASUS ROG Strix G17 (2022) featuring the Ryzen 9 6900HX (APU) and the GeForce RTX 3070 Ti (dGPU) along with 16GB of DDR5-4800 memory.
- Strix G17 (2022) Price: $2,100-2,500
- Strix G15 (2021) Price: $1,109
As usual, gaming is one of the key highlights of the ROG family. In this case, the GeForce RTX 3070 Ti delivers well over 60 FPS in every title we tested, including ray-traced heavy-weights Control and Cyberpunk 2077. The Strix 17 nets an average of 107.6 FPS in Control at the High preset (1080p) with ray-tracing set to medium and DLSS at Balanced. In Cyberpunk 2077, we get an average of 59 FPS at the Medium Ray Tracing Preset at 1080p. Hitman 3 and Crysis Remastered also see the Ryzen 9 6900HX/3070 Ti combo push over 90 FPS.
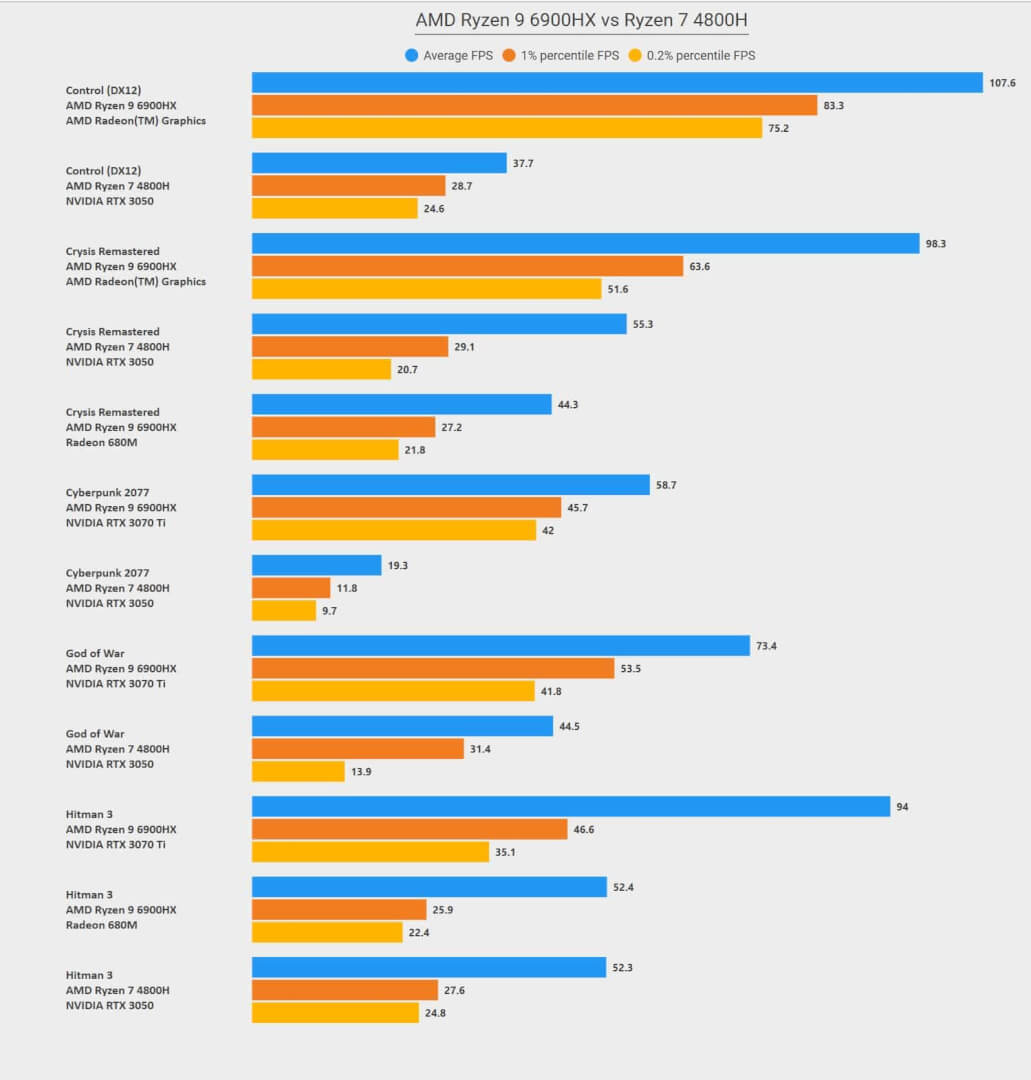
For comparison purposes, we tested the ROG Strix G15 featuring the Ryzen 7 4800H and the RTX 3050 and 16GB of DDR4-3200 RAM. The GPUs of the two notebooks are in completely different leagues but that’s the only SKU we had on hand. Obviously, it gets obliterated by the RTX 3070 Ti but that’s not what we’re focusing on here.
The Radeon 680M iGPU on the 6900HX actually manages to offer comparable performance to lower-end dGPUs. We got an average of 52 FPS in Hitman 3 (1080p, low preset) and lows of 22-26 FPS. In comparison, the RTX 3050 scores 52 FPS at 1080p High, with lows of 24-28 FPS. In Crysis Remastered (a game with ray-traced shadows and reflections), the Radeon 680M once gain performs similar to the RTX 3050 with an average FPS of 44 FPS at 1080p Low. The RTX 3050, on the other hand, nets an average of 55 FPS at the High preset. Granted, this isn’t an apples-to-apples comparison, but for an iGPU to perform in the same ballpark as a dGPU is quite remarkable.
Moving on to content creation, we’ll use a compact but effective suite consisting of Blender, Cinebench R20, and R23. Sorry, but we got a limited window to test the notebook.
In Cinebench R20, the Ryzen 9 6900HX is 25% faster than the 4800H in both the single-threaded and multi-threaded benchmarks. Cinebench R23 sees the 6900HX beating the 4800H by over 30%, quite impressive considering the two were launched just two years apart.
In Blender, the two notebooks show similar performance with a delta of 25% in the three scenes.
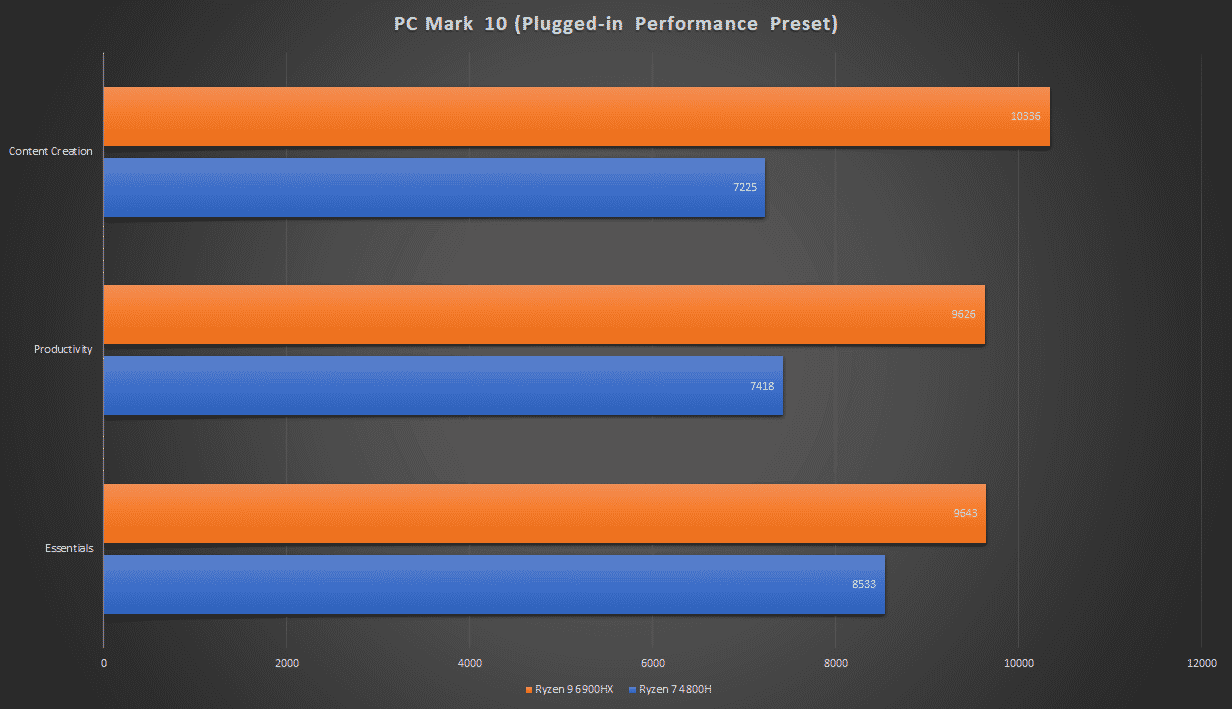
Last but not the least, we have PCMark 10, a handy application for tracking the CPU and GPU stats across different workloads.
As expected, the 6900HX is 15-30% faster than the 4800H with the largest gains coming from content creation.
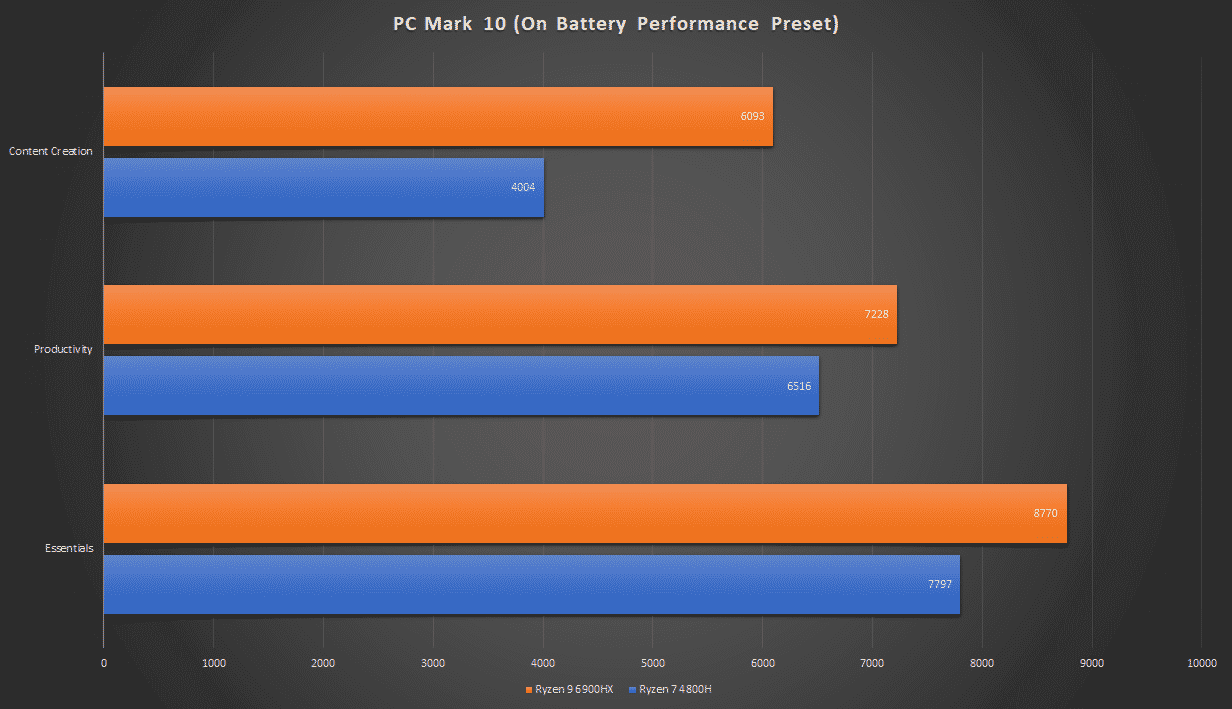
On battery power (High Performace preset), the performance deltas between the two drop to under 15% in all but content creation (rendering/editing). In the latter though, the 6900HX is a whole 50% faster than the 4800H.
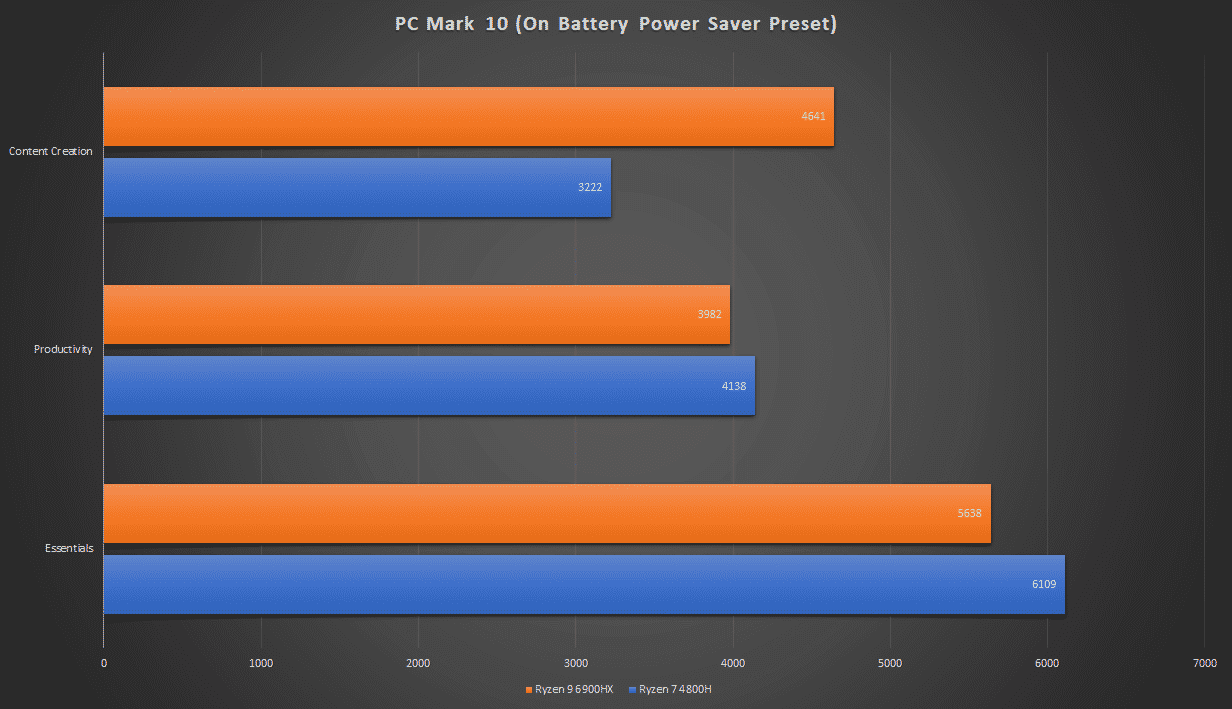
The results get even more perplexing on the Power Saver preset (on-battery). In productivity and essentials, the Ryzen 7 4800H actually manages to beat the 6900HX by a decent margin. Content creation, however, continues to favor the latter albeit by a smaller margin.
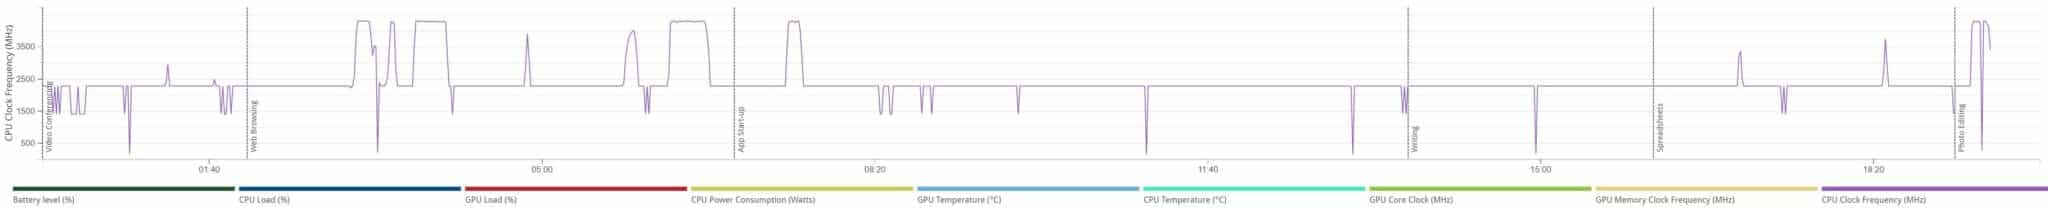
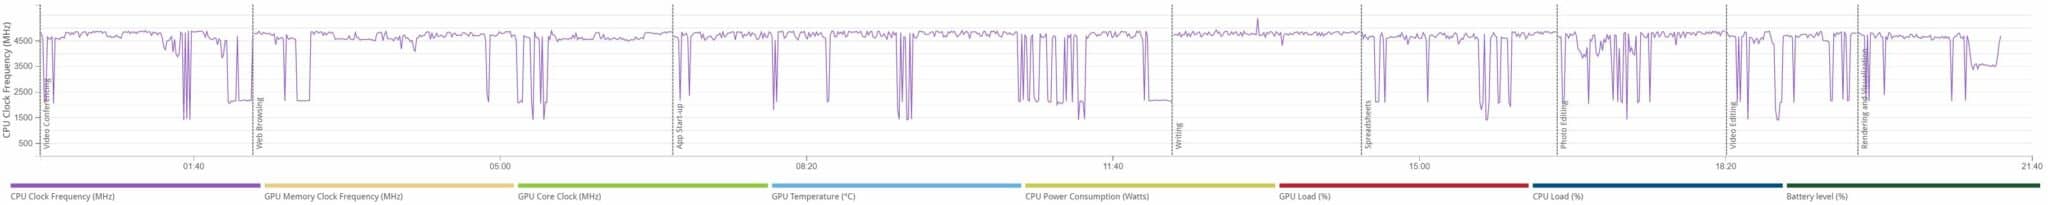
Looking at the frequency graphs for the battery saver preset, the results start to make sense. The Ryzen 9 6900HX runs at just 1.8GHz on average through the course of the benchmark. Meanwhile, the 4800H regularly spikes to the 4GHz mark while maintaining an average of nearly 2GHz. This explains the low scores in the lightly threaded benchmarks.
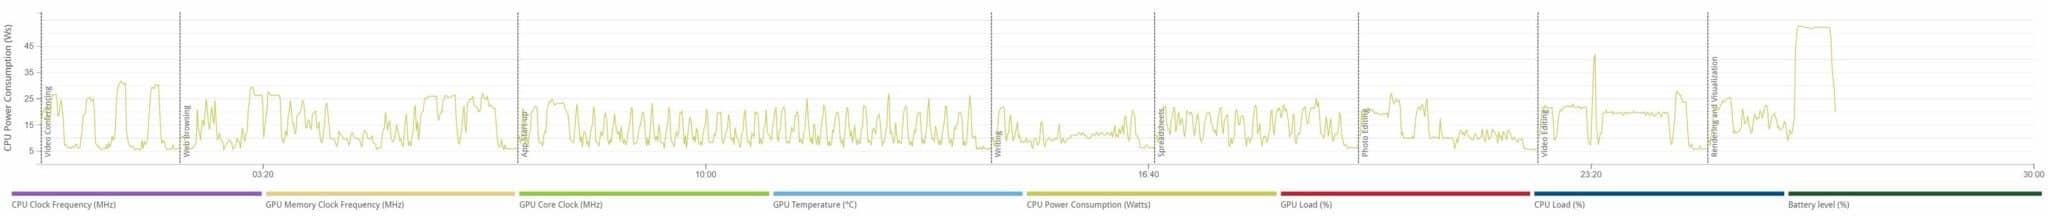
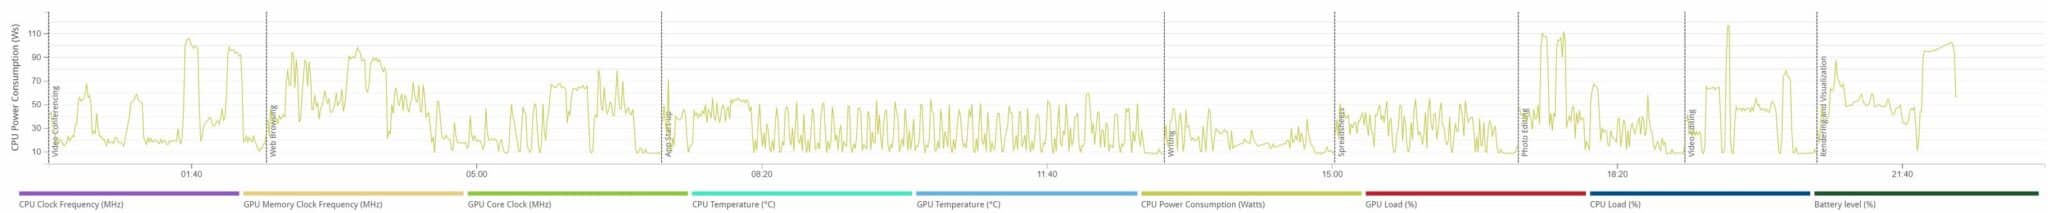
The power consumption of the Ryzen 9 6900HX is a little less impressive. The 4800H stays below 10W through the entirety of the second half of the benchmark. Meanwhile, the 6900HX has a very erratic draw, jumping from 15W to 25W every now and then.
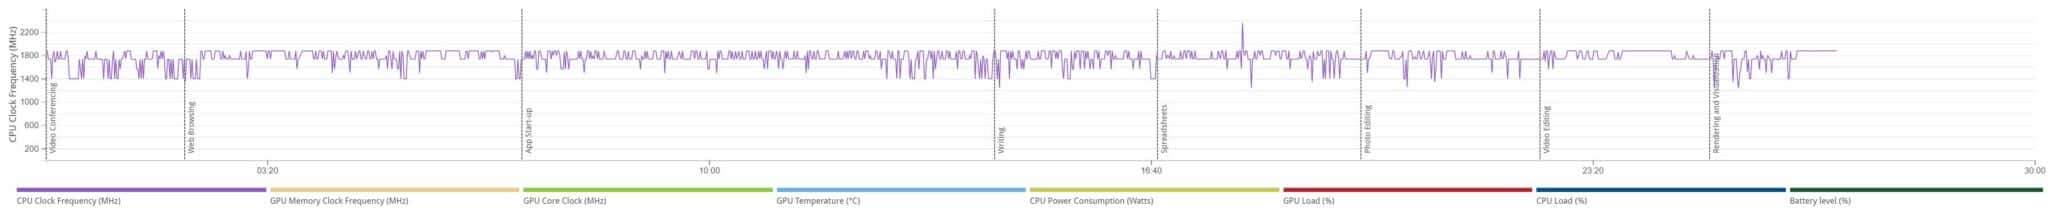
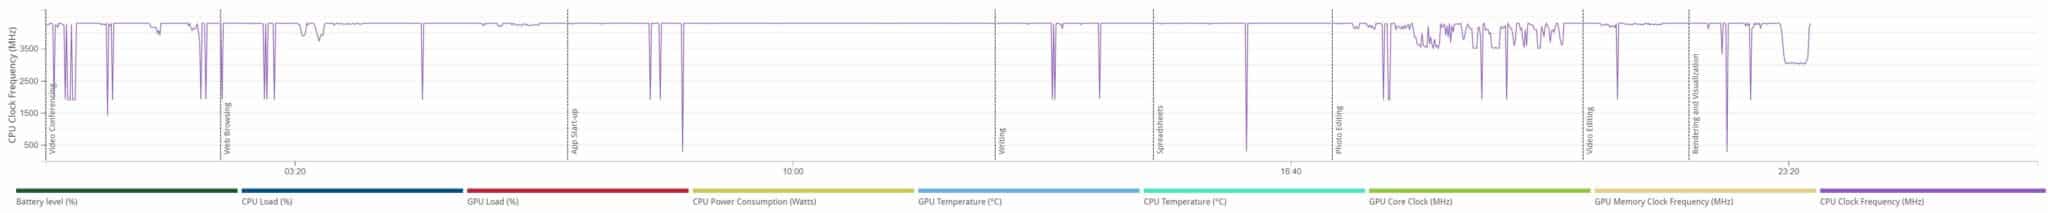
Using the high-performance preset (on battery), the Ryzen 9 6900HX maintains a boost clock of 4.5GHz while the 4800H runs into a hard ceiling at 4.25GHz.
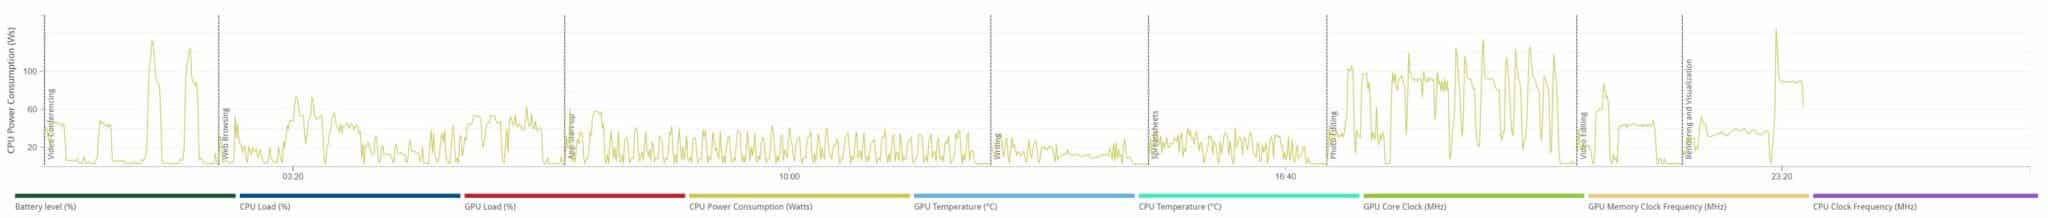
The power consumption figures are more or less the same. The Ryzen 9 6900HX sees more frequent spikes in draw due to the highly responsive power profiles.
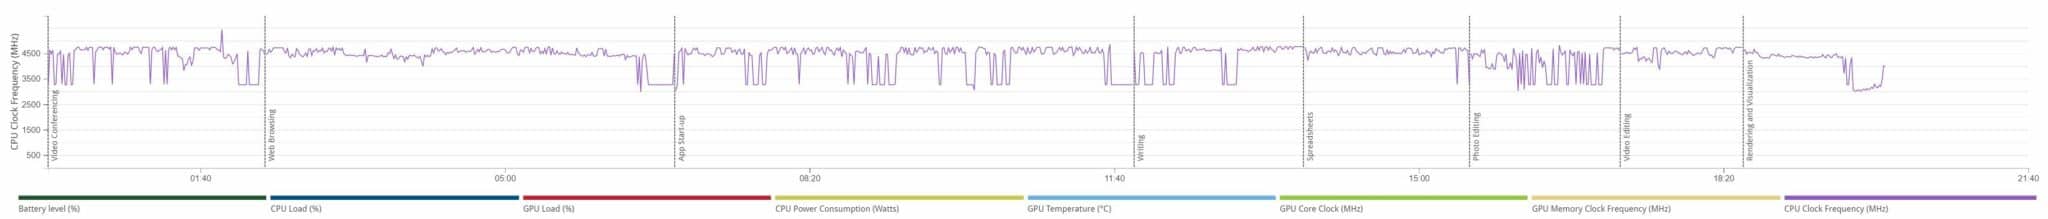
Finally, we have the plugged-in frequency charts. There’s actually not much difference between the on-battery and plugged-in clocks, unlike what we saw with the Zephyrus G14. The 6900HX stays at 4.5GHz with a single spike to 5.4GHz. The 4800H, however, runs a bit over 4GHz throughout the test.

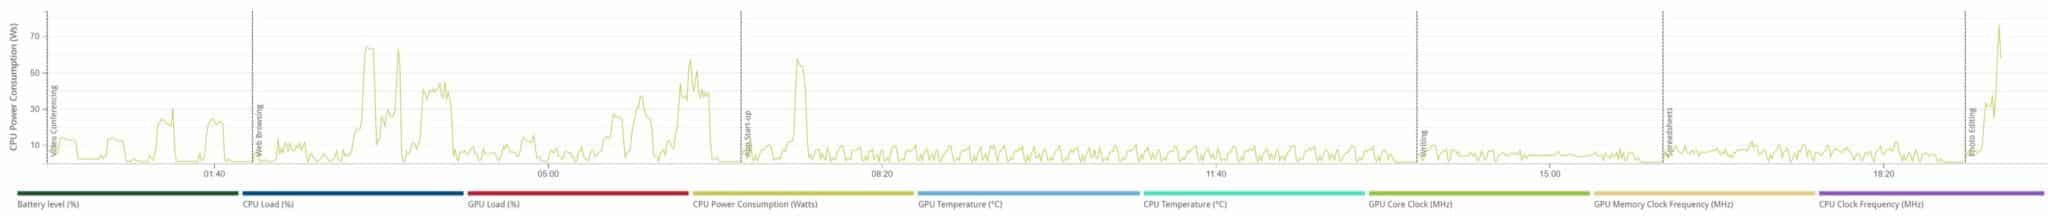
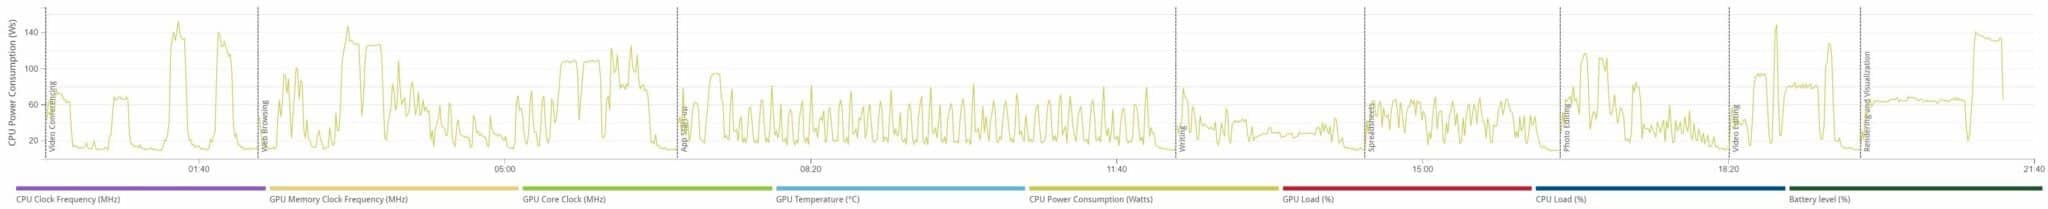
Of course, the power consumption is also the highest in this case. Despite running at roughly the same clocks, the power consumption is notably increased in the case of the 6900HX. We can see spikes of up to 170W, roughly 20W higher than the max draw when on battery.
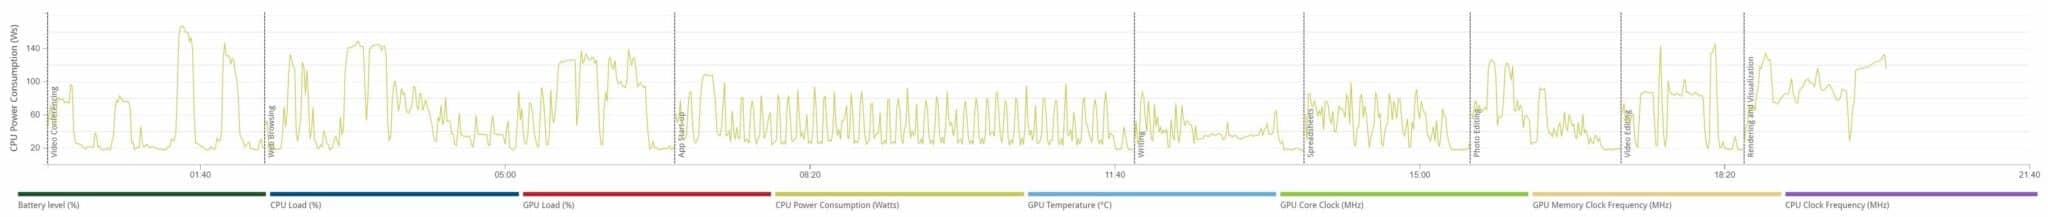
The Ryzen 7 4800H, unexpectedly, draws less power when plugged in. On battery, it maxed out at 142W but here, it stays below 110W (with one spike to 120W near the end) through the entirety of the run.
Conclusion: Impressive for a Refresh
The Ryzen 6000 “Rembrandt” family isn’t technically a refresh. You get a brand new graphics architecture, faster DDR5 memory, and higher clocked CPU cores courtesy of TSMC’s N6 node. The Radeon 680M is the main highlight, offering comparable performance to the RTX 3050/2050. The CPU, although only marginally faster than its predecessor, is incredibly power efficient with a highly responsive power profile.
 AMD Radeon RX 7900 GRE Review: Sapphire Pulse
 AMD Ryzen 5 8600G Review: Best Budget Gaming APU?
 Zotac Gaming GeForce RTX 4070 Ti Super Trinity 16GB Review
 NVIDIA GeForce RTX 4070 Super Review: A Cheaper, Slightly Slower 4070 Ti