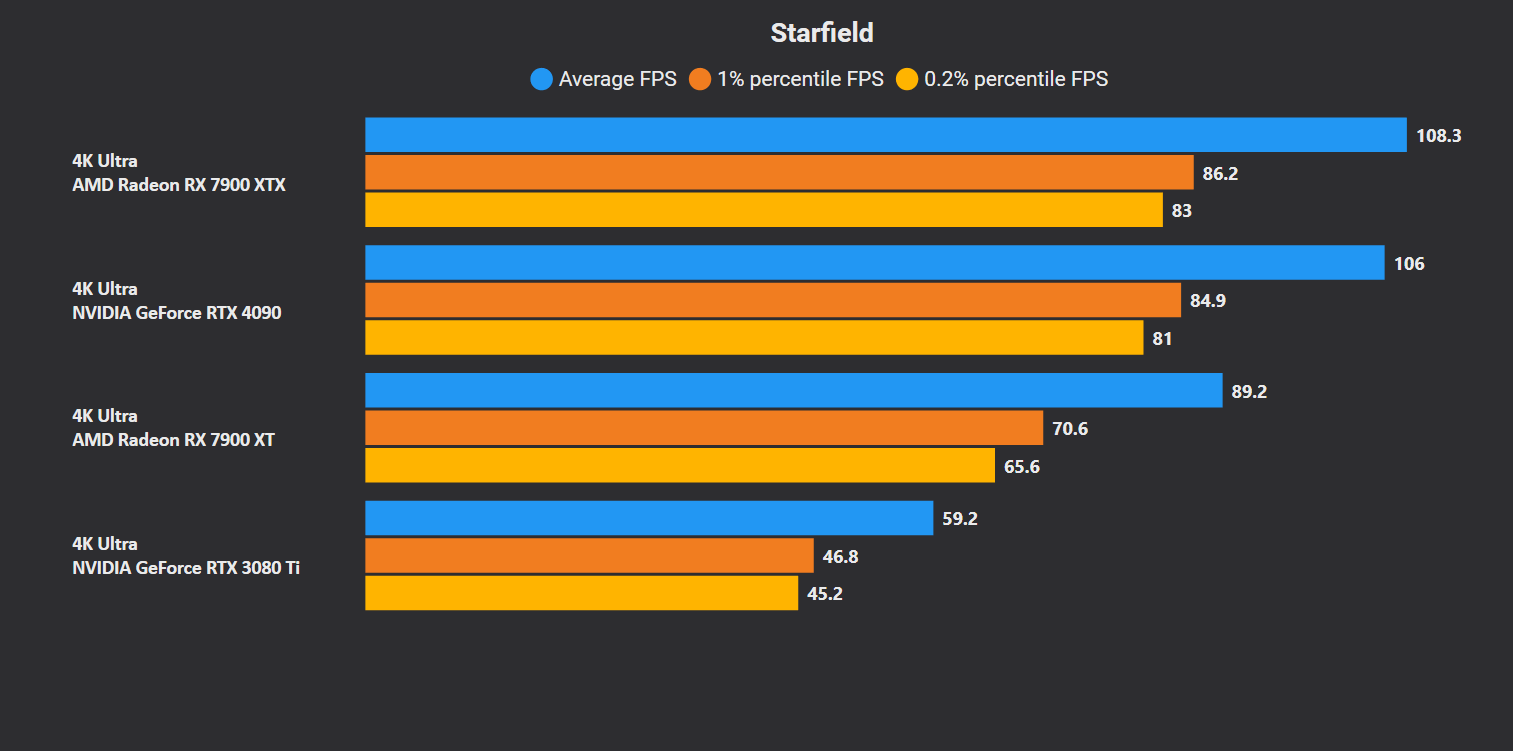
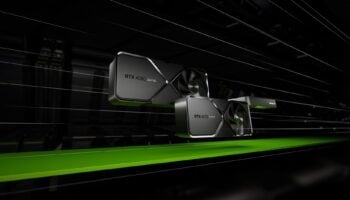
AMD Radeon GPUs perform substantially better than their GeForce counterparts in Starfield, so much so that the $999 RX 7900 XTX is able to beat the $1,599 RTX 4090. The previous-gen RTX 30 and 20 series cards perform especially poorly, with the RTX 3080 Ti being nearly 40% slower than the RX 7900 XT. ChipsandCheese analyzed the hardware utilization of various GPUs in Starfield to get a better understanding of these numbers.
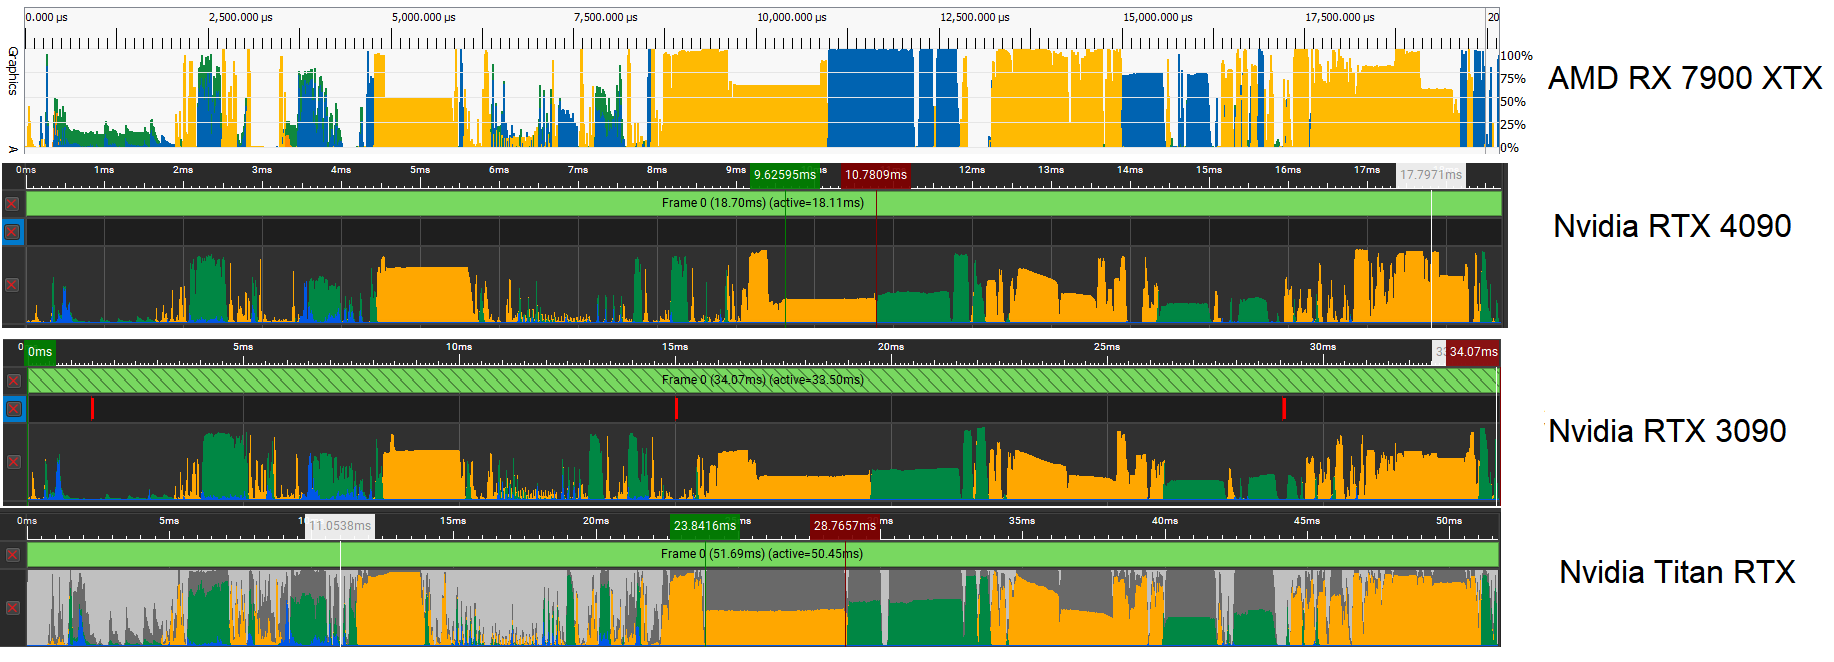
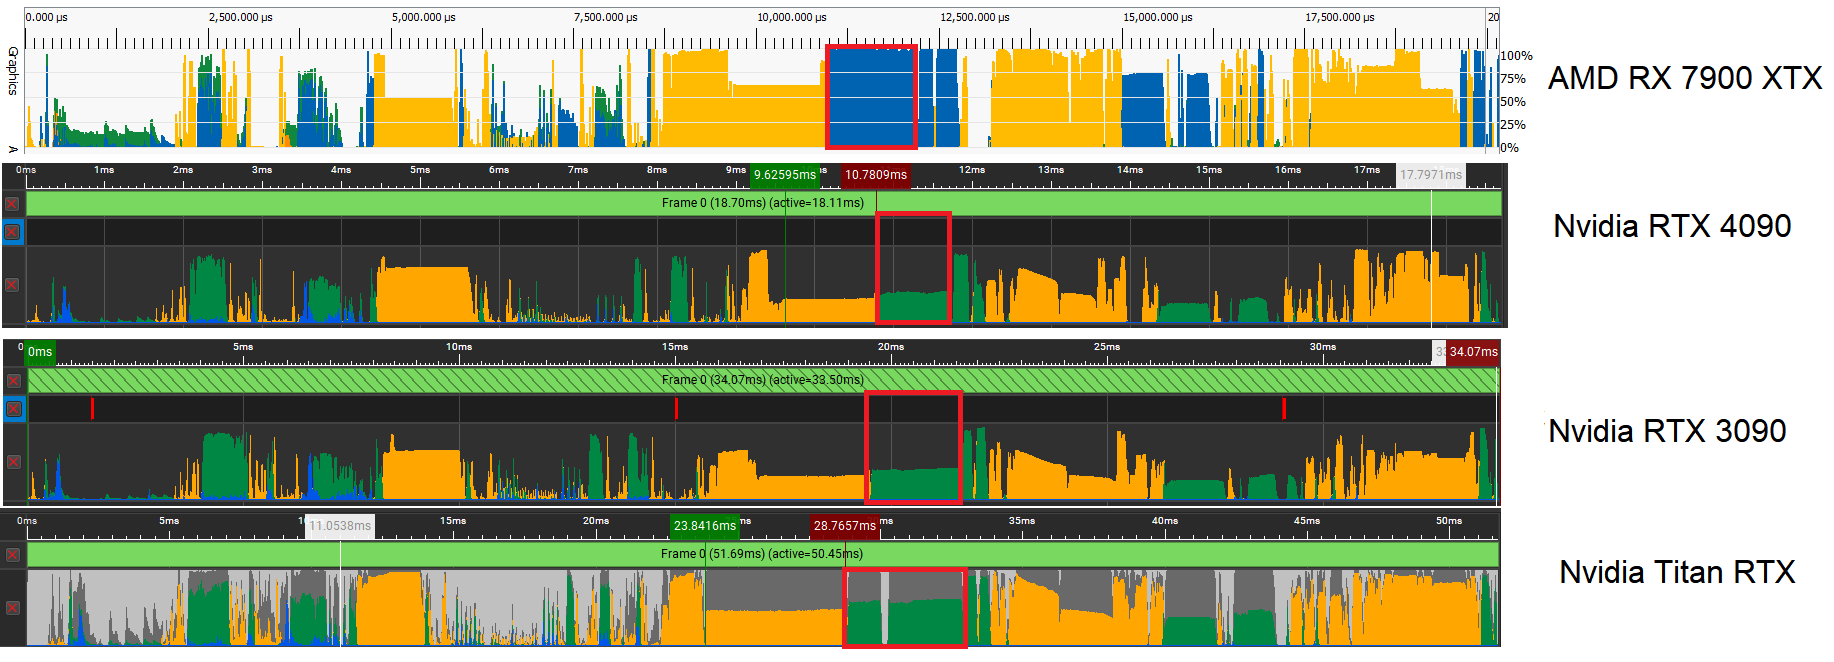
AMD and NVIDIA’s GPU profiler tools were used to analyze the hardware utilization per frame across four GPUs: the RX 7900 XTX, the RTX 4090, the 3090, and the Titan. While the allocations are mirrored across all GPUs, one thing is clear. The RX 7900 XTX has a higher utilization than the RTX 4090 throughout.
The primary discrepancy between the RDNA 3 and Ada Lovelace can be seen in terms of compute shader utilization, which involves vALUs or stream processors on AMD and CUDA cores on NVIDIA GPUs. Scheduling happens on a wave or warp level, with each containing 32 threads (64 in some cases for Radeon). Each SIMD or SMSP keeps multiple waves/warps active to be able to switch to a different one in case of a stall. For Team Red, Vector ALUs or vALUs are used for just about everything, leaving the scalars for address generation and control flow.
NVIDIA’s Nsight tracks shader utilization via a metric known as “SM Issue Active,” which essentially translates to the percentage of warps issued out of the theoretical peak. Here, the RX 7900 XTX has a notable lead with a vALU utilization of 69% and sALU utilization of 26%. The GeForce RTX 3090 and 4090 maintain a percentage of over 40% (overall), while the RTX Titan drops to a paltry 26%.
This indicates that doubling the FP32 throughput in Ampere by adding an alternate datapath to the INT32 clusters notably helps with SM utilization. Regardless, the Radeon RX 7900 XTX enjoys a superior position on account of its higher shader utilization. Much of this boils down to occupancy. GPUs are all about parallelism and tricks to increase parallelism. This includes in-air switching of waves/warps as well as finer-grained thread scheduling based on convergence and/or divergence (especially in ray-tracing).
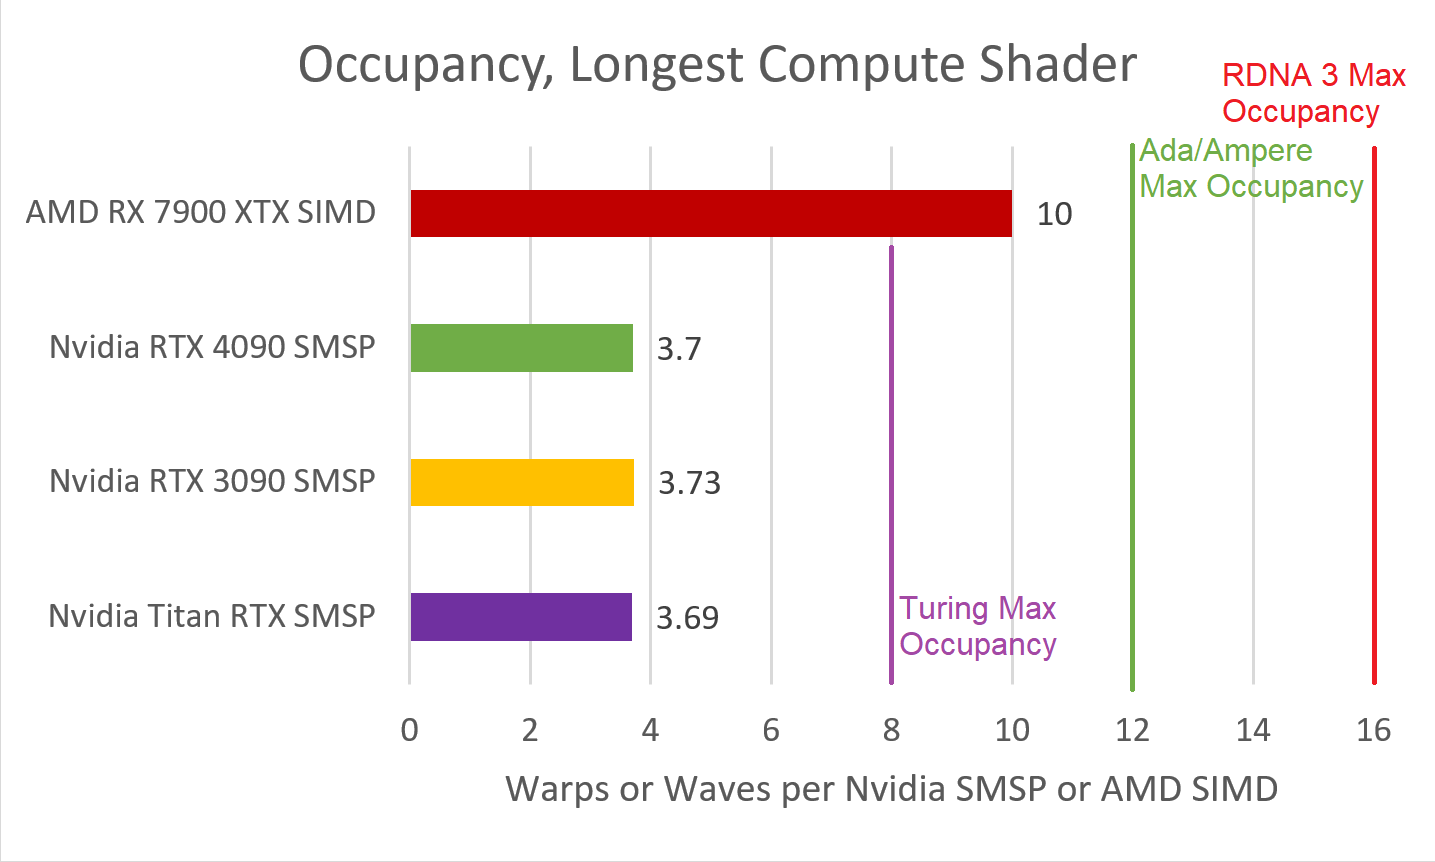
When it comes to shader occupancy, the Radeon RX 7900 XTX is in a league of its own with 10 waves per SIMD (on average). The GeForce RTX 4090 is limited a just 4 warps per SMSP. Before we move on, it’s worth remembering that RDNA 3 SIMDs have a maximum capacity of 16 waves, while Ada/Ampere sub-SMs are limited to 12. This ceiling is rarely attained, however, as cache and/register constraints prevent it.
The Radeon RX 7900 XTX has a vGPR capacity of 192KB (50% higher than the 6900 XT), which plays a key role here. Each thread takes up to 18.4KB of vector registers, allowing the allocation of 10 waves per SIMD.
Meanwhile, on NVIDIA’s end, each SIMD has a 64KB register size, which limits the issue of warps, as no available register file was found for the newer launches, thereby limiting parallelism and occupancy. In addition to the compute shader, the pixel shader also sees glaring differences in the RTX 4090 and RX 7900 XTX utilization.
Once again, the Radeon has a much higher vector utilization compared to its GeForce counterpart: 89% vs. just 60%. The Ampere-based RTX 3090 sees similar numbers, while the Titan (Turing) suffers on account of separate INT/FP pipelines.
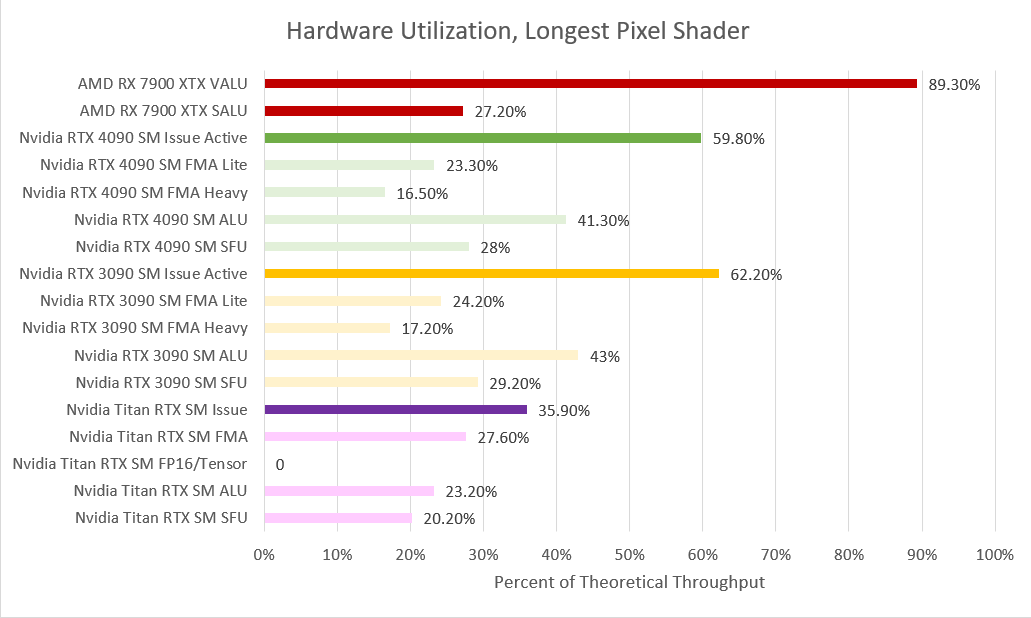
The shader occupancy is even better on the RX 7900 XTX in this case, with 16 waves per SIMD. On the other hand, the GeForce RTX 4090 averages just 5 warps. The reason is limited register availability, which prevented the launch of additional warps, leaving the GPU with fewer warps to switch between.
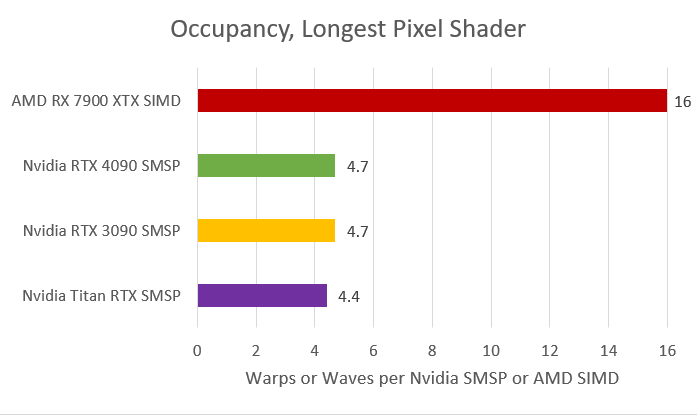
The Radeon RX 7900 XTX uses 12KB of vGPRs per thread, which rounds up to 192 KB, the exact same register size of each RDNA 3 SIMD. Using the same logic to the RTX 4090 means we’re looking at 60KB of register usage per SMSP (64KB available), severely limiting the issue of additional warps.
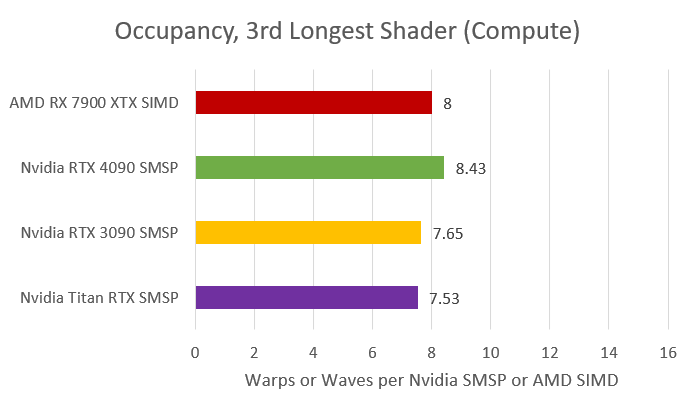
A similar situation arises with the L2 cache bandwidth with one of the other Compute shaders. Despite having a high enough occupancy of 8.4 wraps per SMSP, the RTX 4090 suffers from poor utilization (less than 30%), while the RX 7900 XTX attains an impressive 79%. Interestingly, Ampere has a better rate of utilization and Turing even higher. The reason is the segmentation of FP/INT loads on the Turing SM, which increases the load on the FMA path.
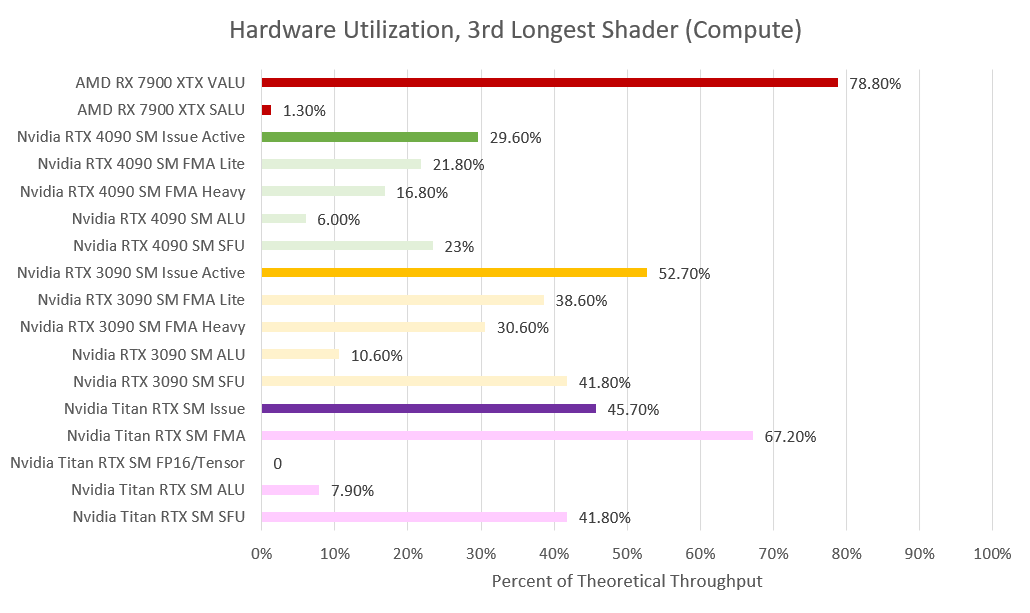
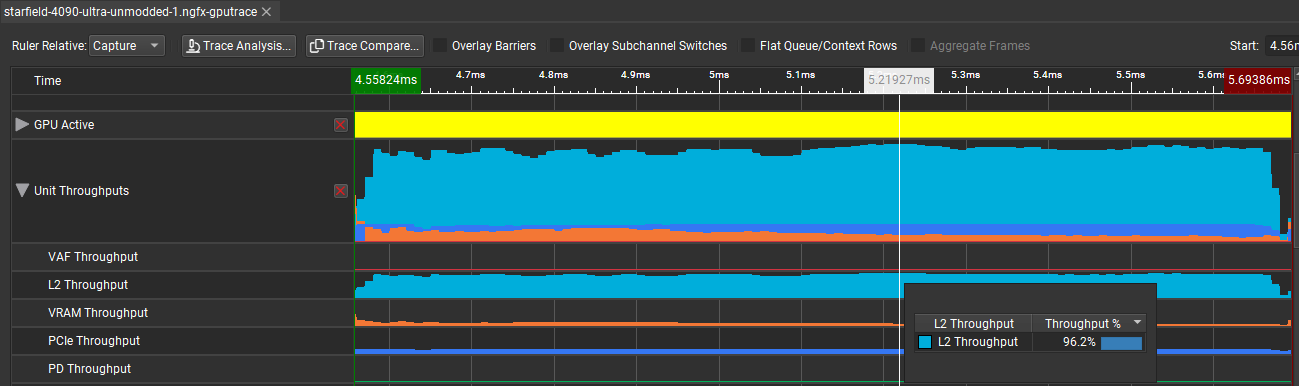
Here, the GeForce RTX 4090 runs into an L2 cache bottleneck. The L2 throughput goes as high as 96%, which offsets the high shader occupancy and tanking utilization. AMD’s higher L2 bandwidth works in its favor here, catching most of the L1 misses.
ChipsandCheese has done a detailed breakdown of Starfield’s GPU hardware allocation. Give it a read if you want the finer-grained points of this discussion.
-
 NVIDIA RTX 5080 Allegedly Launching Ahead of the RTX 5090 in H2 2024
-
 NVIDIA RTX 5090, 5080 & 5070/Ti Mobile to Feature 16GB VRAM via a 256-bit Bus
-
 NVIDIA RTX 5080 Mobile Allegedly Based on GB203 GPU, GDDR7 Memory & PCIe Gen 5
-
 AMD Radeon RX 7900 XT Drops Below $700 (-$210 Off), RX 6800 at $369 (-$310 Off)